
The Accretion Disc
Why crypto, options mania, and the housing crisis are the same phenomenon


Black holes do not consume matter quietly. When a star or a gas cloud falls into one, the material spirals inward through a disc, flattened, compressed, accelerated. The infalling matter superheats. Friction inside the disc produces radiation so intense that the regions immediately around the black hole, including the accretion disc and the relativistic jets that punch out perpendicular to it, are among the brightest objects in the universe.
The black hole itself is invisible. What we see is what it does to everything around it.
I want to apply this picture to British capital allocation. The argument is that the housing market in countries like the United Kingdom now functions, for the propertyless cohort, as something close to a gravitational singularity in their portfolio decisions, and that the speculative behaviours we conventionally treat as separate pathologies (the crypto cycle, the meme stock episode, the 0DTE options explosion, the prediction-market boom) are not separate at all. They are the jets. They are what radiates outward from a market where one asset class has acquired returns the others cannot match.
This is not a moral claim about young people gambling. It is a structural claim about what rational behaviour looks like when the opportunity set is distorted.
I. The asset that ate the frontier
The Markowitz mean-variance framework assumes investors choose portfolios along an efficient frontier: the set of combinations that deliver the highest expected return for any given level of risk. The framework is universal. The frontier is not. Different investors face different frontiers depending on which assets they can access and on what terms.
Consider what a UK homeowner gets. They can lever five-to-one against a deposit through a conventional mortgage. The capital gain on their primary residence is exempt from capital gains tax. The credit channel that funds their purchase is implicitly state-backed: the Bank of England has been clear, since at least 2008, that no reform may be permitted to cause a disorderly decline in property prices that impairs bank balance sheets. The asset is structurally supply-constrained by planning law. It generates imputed rental income that does not appear in measured GDP but does appear in the homeowner’s lived consumption.
Add this up. Leveraged exposure to a tax-advantaged, supply-constrained, implicitly-state-guaranteed asset with imputed yield. The expected risk-adjusted return on UK residential property over the last twenty-five years has been, on these terms, essentially impossible to replicate through any conventional financial instrument. Productive assets, meaning equity in companies that build things, employ people, pay tax, have been comprehensively dominated.
This is the gravitational pull. Every other asset has to compete with it. And the central insight of the accretion disc analogy is that the propertyless cannot compete on the same terms. They can buy the FTSE 100. They cannot buy the FTSE 100 with five-to-one leverage, capital gains exemption, and implicit state backing. The frontier they face is not the frontier the homeowner faces.
What I want to show is that for someone locked out of the dominant asset, the rational portfolio response is to migrate up the risk curve toward distributions that conventional finance theory says are irrational. And that this migration looks exactly like what we observe.
II. The model
Let me set the model out carefully because the result depends on getting the reference point right.
Standard expected-utility theory says an agent maximises:
where $W_{i,t}$ is the agent’s terminal wealth. This is the framework under which lottery assets, meaning assets with negative expected returns and fat right tails, are unambiguously irrational. No agent with a concave utility function should ever prefer them to a productive asset with the same variance but positive expected return.
But this framework treats the agent as living in isolation. In reality, the propertyless agent in a housing-distorted economy is not making decisions in isolation. They are watching their reference cohort, the homeowner population (often including their own peers, siblings, and parents), pull ahead of them. The gap is not abstract. It is the difference between owning a flat in Hackney and renting one. It is whether the agent can have children where they want, on the timeline they want. It is whether their pension is anchored to a home or to a screen.
So the relevant utility function is reference-dependent. Define the agent’s reference wealth as the trajectory of the median homeowner:
where H is the housing asset, lambda is the leverage factor (mortgage LTV), and D is debt service. The agent’s utility becomes:
where gamma captures how much weight the agent puts on the gap. This is not exotic machinery. It is the catching-up-with-the-Joneses framework of Abel (1990) and Galí (1994); the habit-formation models of Campbell and Cochrane (1999); the reference-dependent preferences of Kőszegi and Rabin (2006). It is well-established. It is rarely applied to housing.
When gamma is high, as it will be for someone who has internalised “as safe as houses” and watches the housing trajectory pull away, something striking happens. A productive asset with positive but modest expected return and low variance can deliver negative expected utility, because R is growing faster than W. The agent is falling behind in the only metric that matters. The productive asset offers no probability of closing the gap. It has zero mass in the region where:
Now introduce a high-kurtosis, high-skew gambler’s asset with:
but with a fat right tail such that:
Under standard expected utility this asset loses to the productive asset on every dimension that matters. Under reference-dependent utility, the gambler’s asset can dominate. It is the only asset with any probability mass in the region where the agent can close the gap to the homeowner. For a relative-wealth maximiser, some chance beats no chance.
This is the cleanest version of the argument. It survives the semi-strong form of the efficient markets hypothesis: the propertyless agent knows the productive asset has positive expected return, knows the gambler’s asset has negative expected return, knows housing is structurally favoured, and chooses the gambler’s asset anyway because they are optimising over the right utility function.
The stronger version uses full prospect theory. Set the reference point at R. The propertyless agent is permanently in the loss domain, because they wake up every day below their reference point and the gap is widening. Prospect theory has a specific, well-documented prediction for agents in the loss domain: the value function is convex there. They become risk-seeking. Not risk-tolerant. Risk-seeking. The convexity of the value function in losses means they prefer a gamble with negative expected value to a certain small loss. Combine this with probability weighting (small probabilities overweighted, the empirical signature of human risk perception) and you get an agent who is actively attracted to lottery-like distributions, not despite their structure but because of it.
The reference-dependent EU version is publishable. The prospect-theory version is true.
III. The empirical link
The model has a sharp empirical prediction. Holding age, income, and gender constant, the propertyless should hold a higher share of high-risk speculative assets than the propertied. The mechanism is internal to the agent’s portfolio choice, so the test does not require cross-country comparison. It only requires a survey that asks people what they own and what their housing tenure is.
The FCA Financial Lives Survey does exactly that. It is the largest survey of UK adult financial behaviour, conducted every two years, with a sample of around 19,000 people. It defines a “high-risk investments” basket comprising cryptoassets, contracts for difference, peer-to-peer lending, unlisted company shares, Innovative Finance ISAs, and mini-bonds. And it breaks holdings by housing tenure.
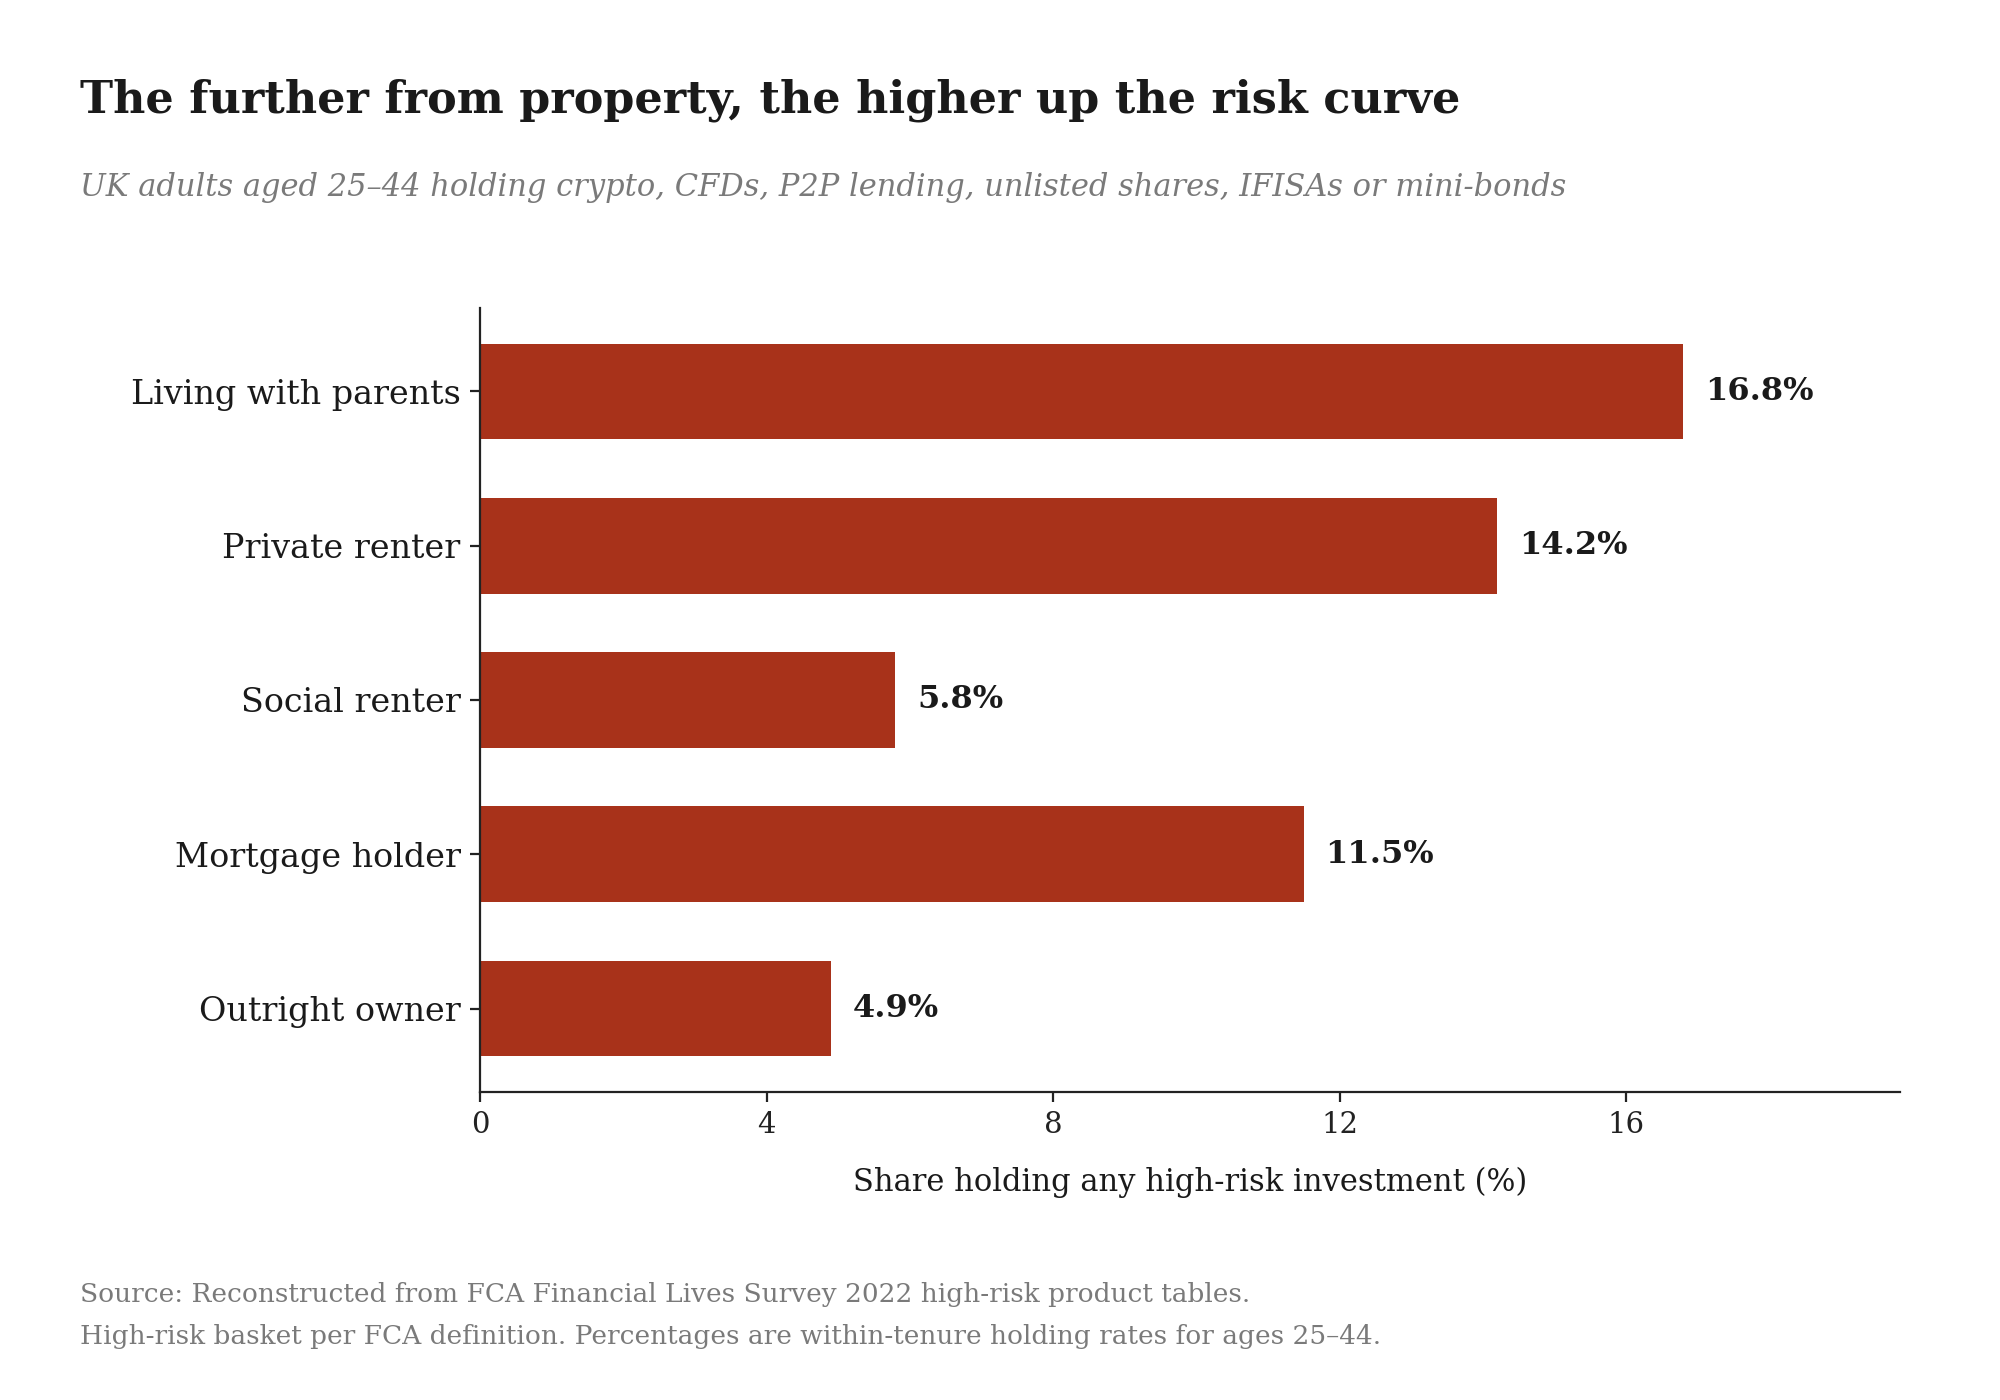
The pattern is exactly what the model predicts. Outright homeowners, the people who have most fully captured the housing asset, hold these instruments at about a third the rate of private renters. People living with their parents, the cohort furthest from the housing asset and most acutely confronted with the gap between their position and the homeowner trajectory, hold them at over three times the outright-owner rate. The mortgage-holder rate sits between the renter rate and the owner rate, which is consistent with the model: the mortgage holder has partial exposure to the dominant asset, which moderates but does not eliminate the lottery-asset attraction.
The social renter bar requires its own treatment. At 5.8% it sits lower than every other tenure category except outright owners, which looks at first glance like a counter-example. It is not. Social renters have median household incomes well below the population median, low or zero investable wealth, and high rates of benefit receipt. Around 40–45% of social tenant households have no savings at all. The figure is low not because this cohort is more risk-averse than private renters but because they have no investable portfolio to allocate. The lottery-asset migration requires both the motive (the gap to the homeowner reference cohort) and the means (deployable capital). Social renters have only the motive. This is a feature of the model rather than a counter-example to it, and we will return to what happens to that motive when conventional speculative venues are out of reach.
Two objections to anticipate. First: this could be an age effect. Young people both rent and gamble. The chart pools ages 25–44, but the FCA breakdowns within narrower age bands show the tenure gradient holds. Second: it could be an income effect. Renters earn less. But the FCA’s own analysis shows that within income quintiles, the housing tenure split predicts high-risk holdings, and the direction runs against the income story, because crypto holders skew higher-income within their cohort, not lower. The cleanest interpretation is that tenure status is itself the variable doing the work. The model says it should be. The data agrees.
The within-country time series tells the same story from a different angle:
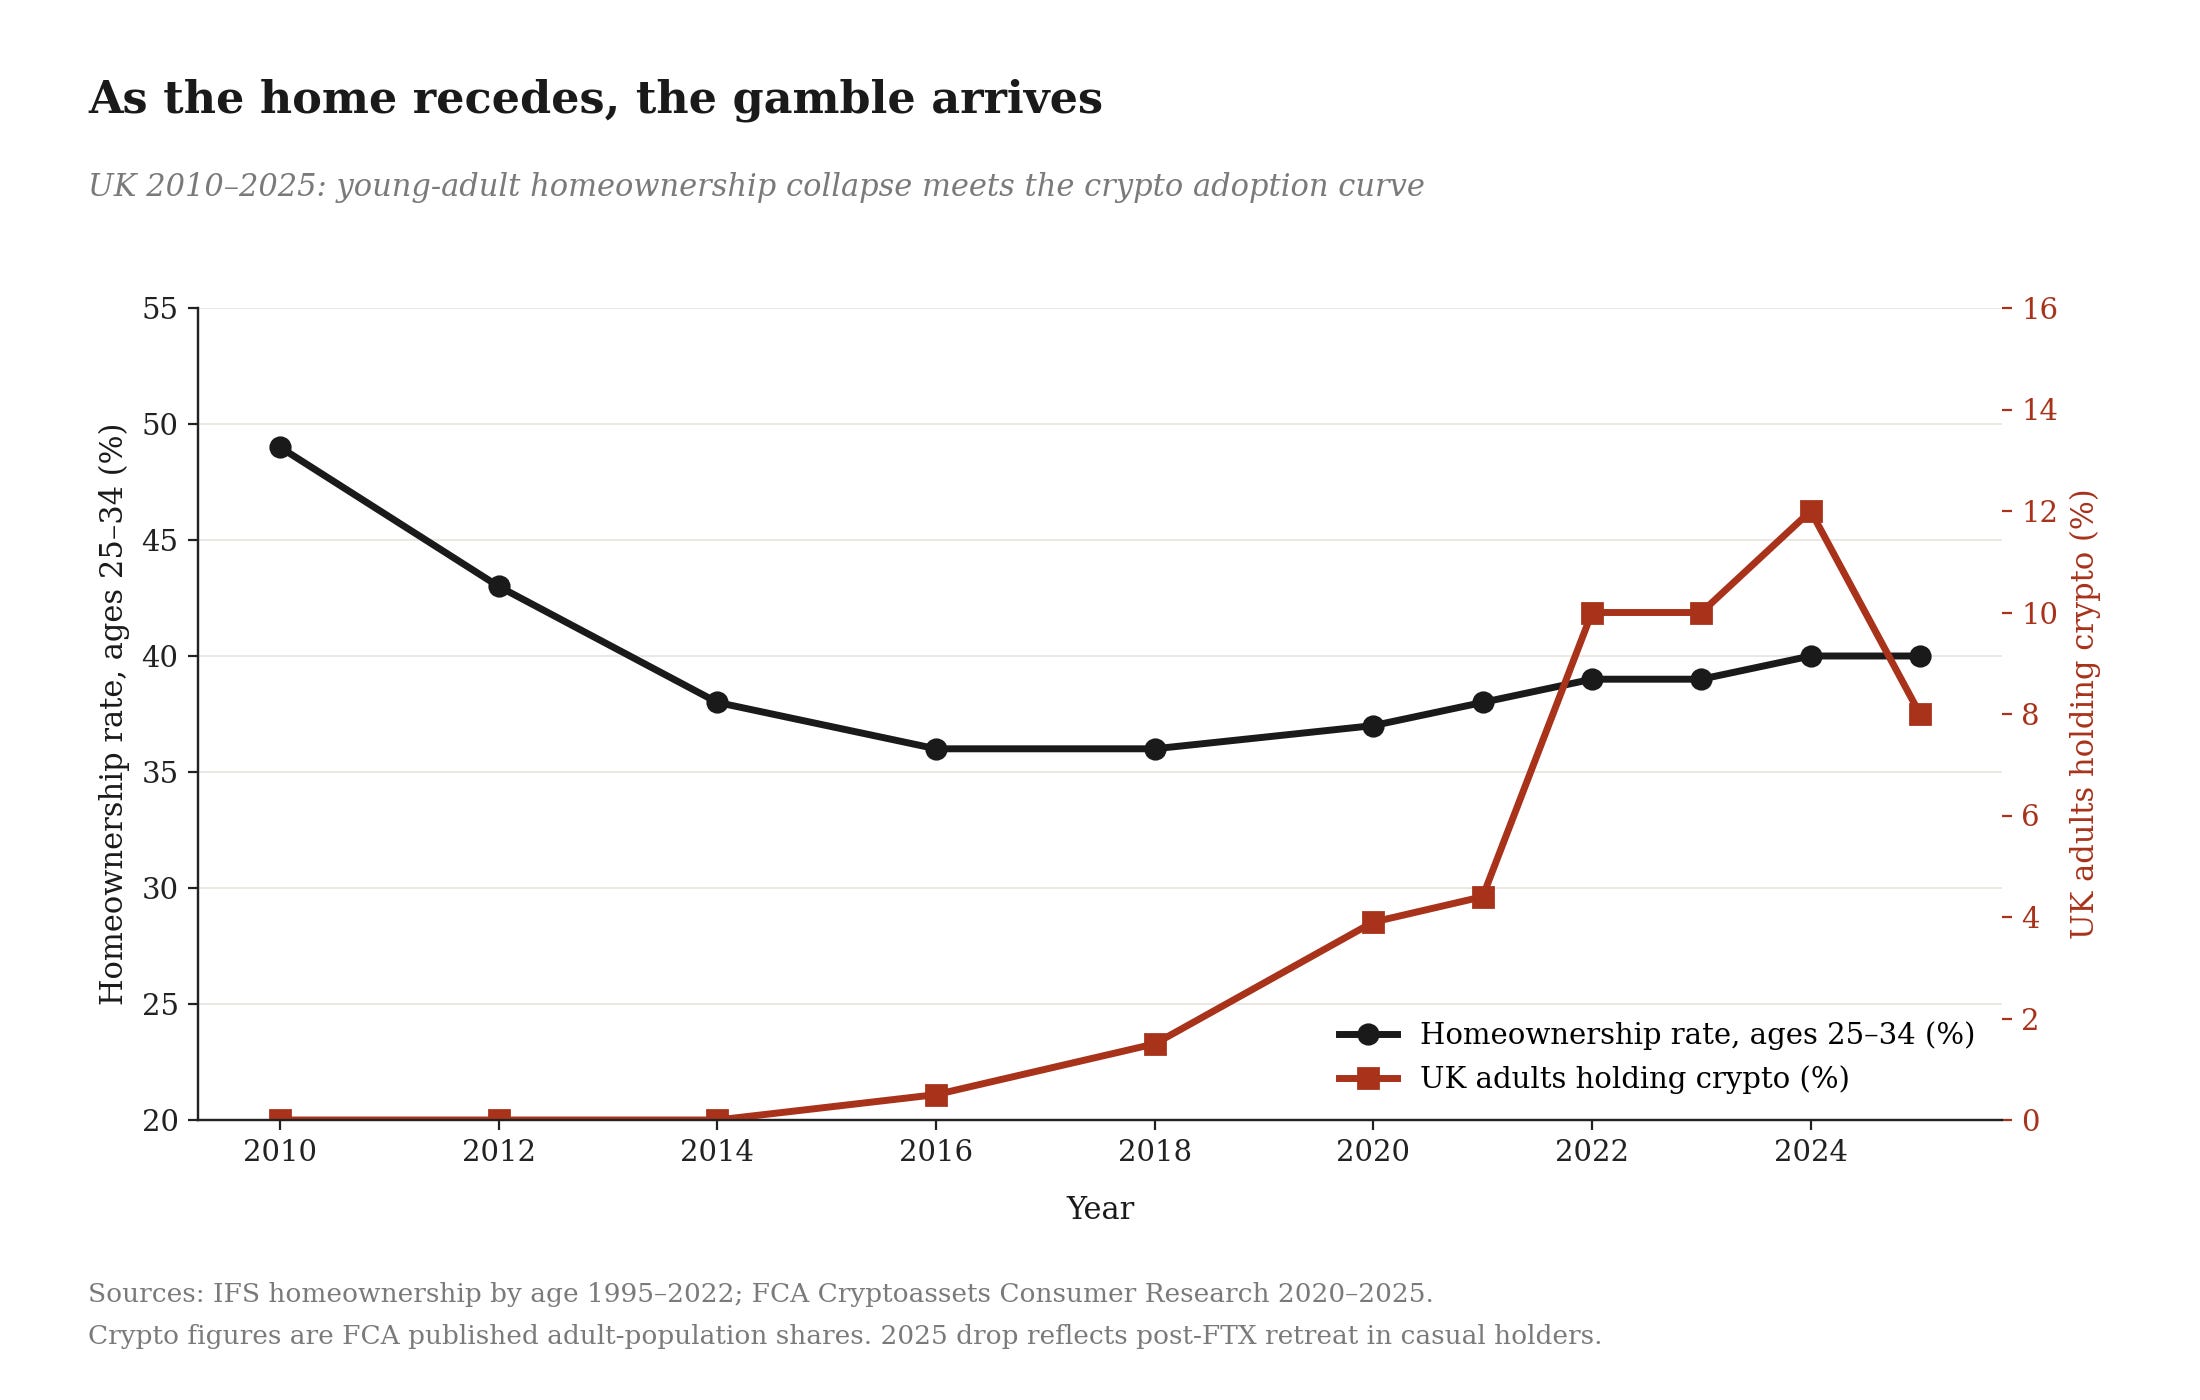
The collapse of young-adult homeownership in the UK from 2010 to 2016 is one of the largest peacetime tenure shifts in modern British history. At age 27, those born in the late 1980s had a homeownership rate of 25%, compared with 33% for those born five years earlier. The pandemic-era crypto adoption surge maps cleanly onto this earlier collapse.
The lag is generational: the cohort that had homeownership taken from them in 2010–2016 is the cohort that bought Bitcoin in 2020–2022.
IV. The cross-country puzzle
If the mechanism is real, the cross-country pattern should also hold. Countries with more dysfunctional housing markets should show more retail speculative behaviour. The Anglosphere (UK, US, Canada, Australia, Ireland) should sit well above Germany, Japan, Italy.
This is where the analysis gets messier, and I want to show this honestly rather than fish for the chart that confirms the theory.
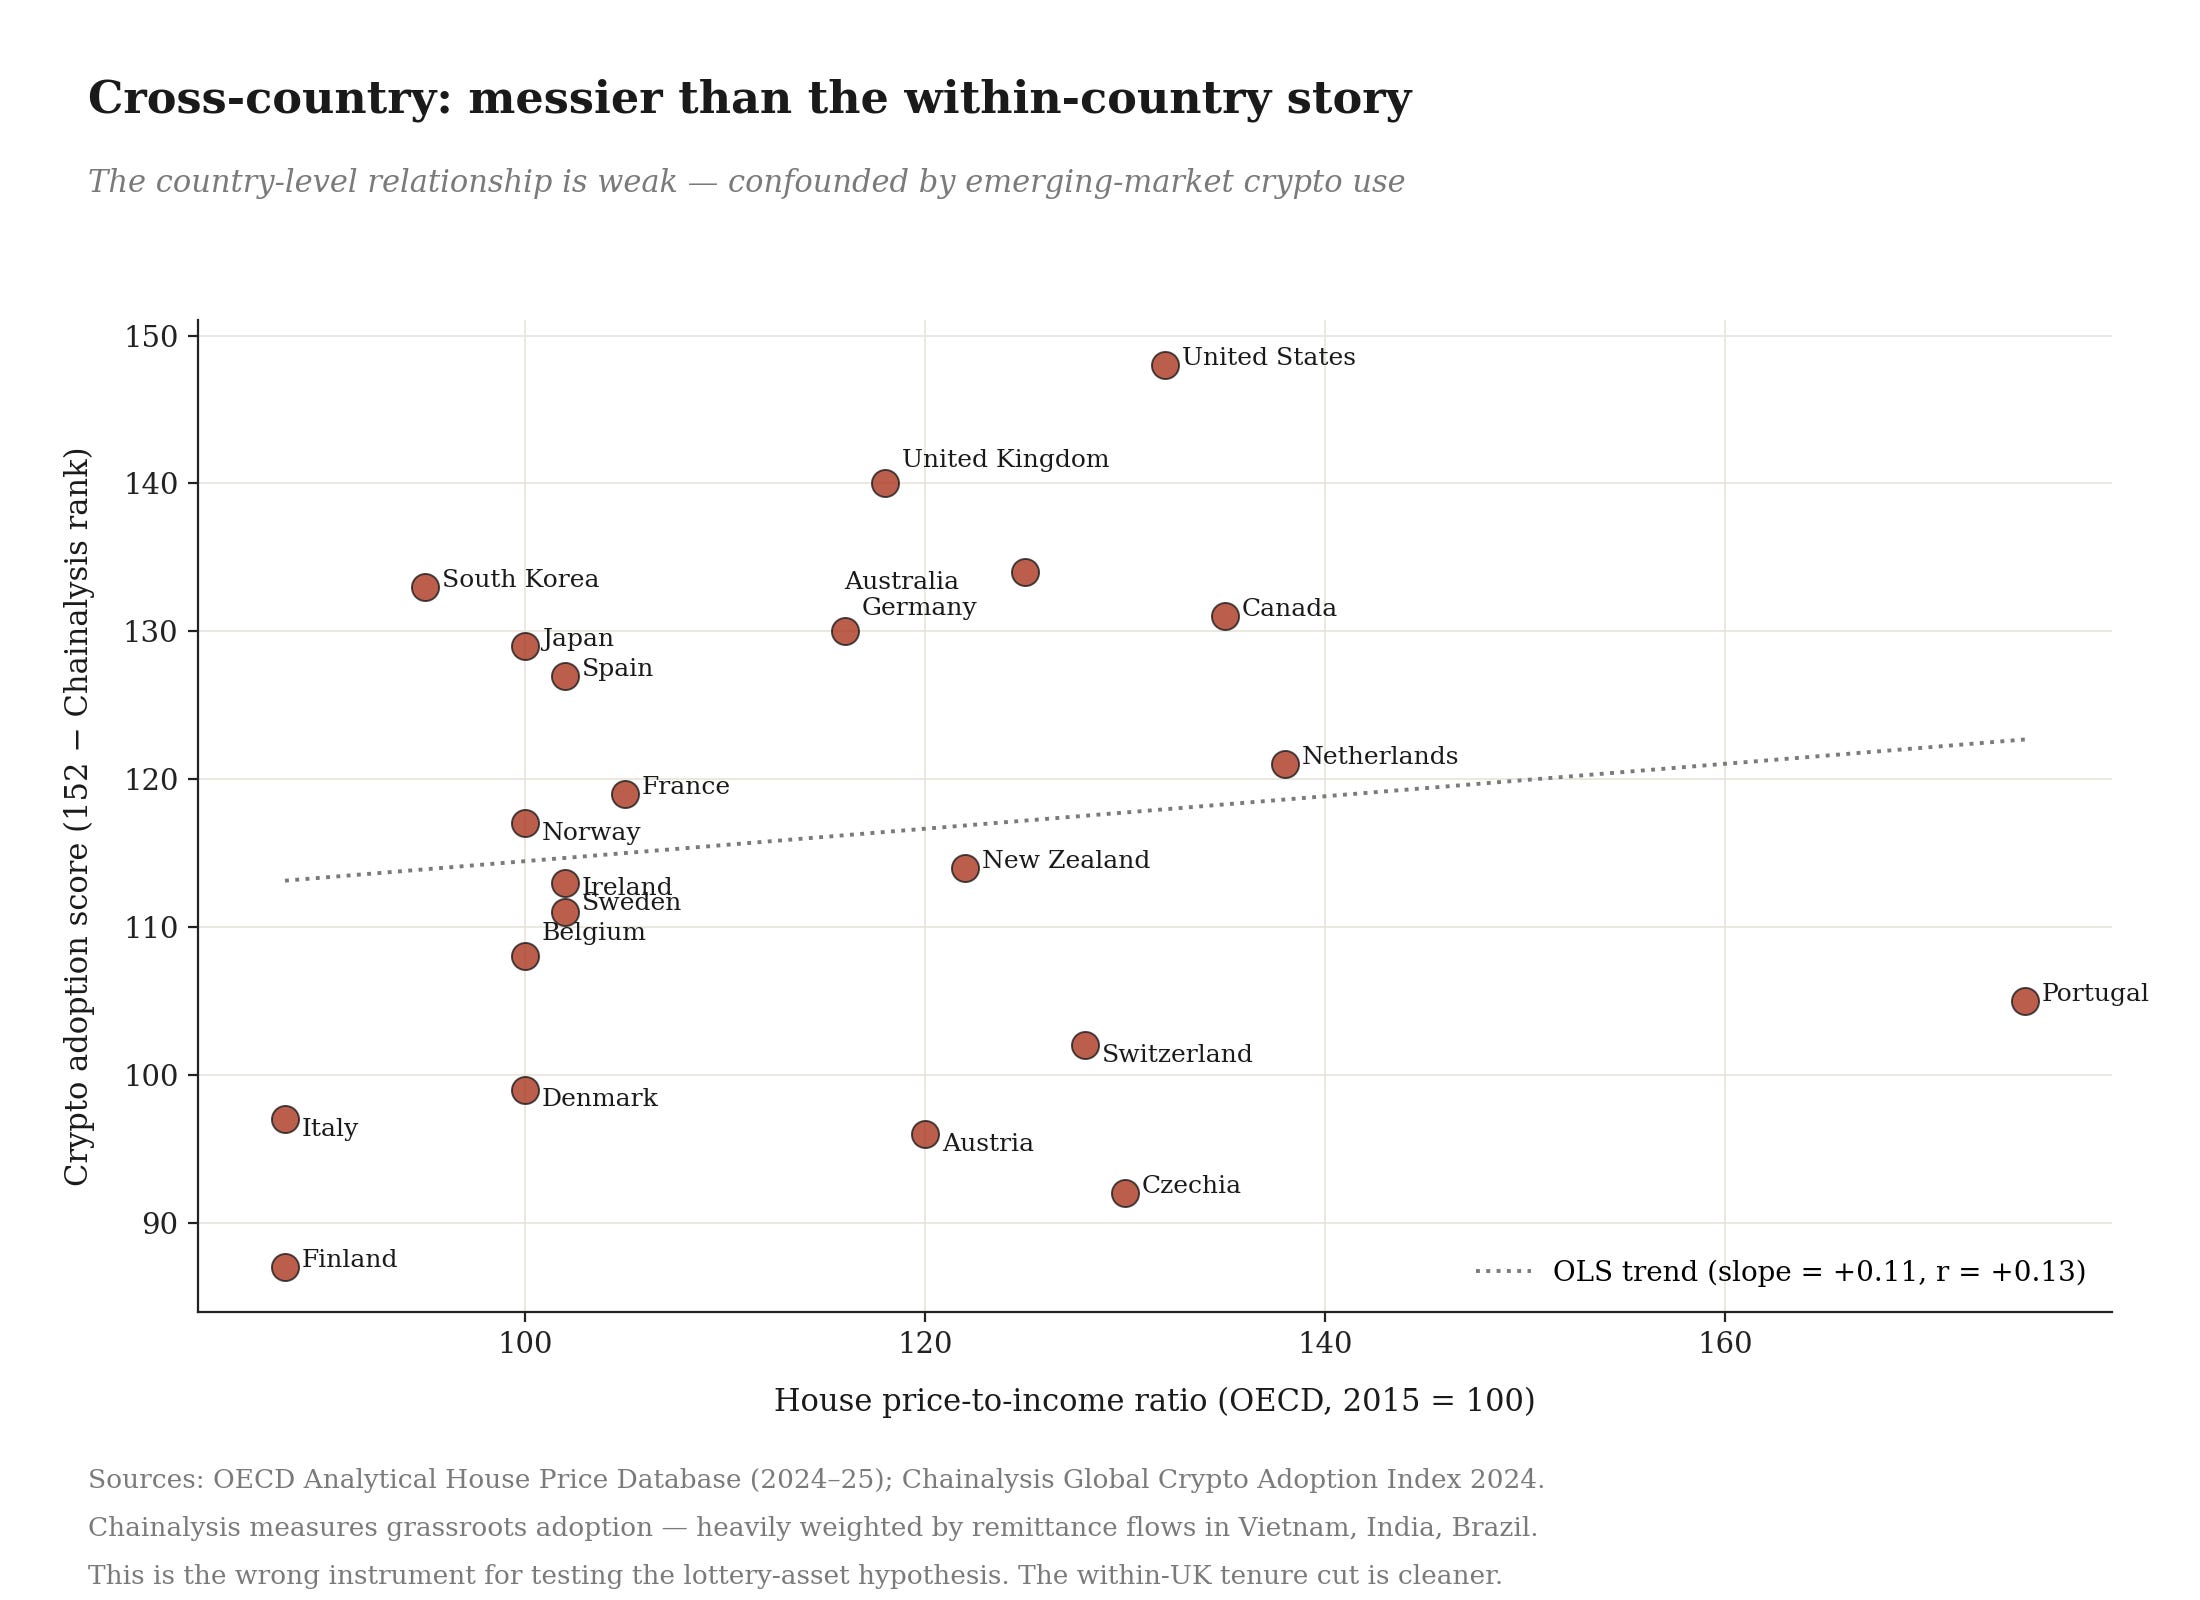
The country-level scatter shows a weak positive relationship (the trend line slopes the right way) but the correlation is low and several countries sit awkwardly. Portugal has the worst housing affordability in the OECD but ranks middling on Chainalysis crypto adoption. Italy and Finland have the most affordable housing and the lowest adoption, which fits. But South Korea, Japan, and Germany, countries with reasonable housing affordability, rank surprisingly high.
The problem is that the Chainalysis Global Crypto Adoption Index is the wrong instrument. It measures grassroots crypto activity, which is dominated by remittance flows in Vietnam, India, Brazil, and the Philippines, places where crypto is functioning as monetary infrastructure, not as a lottery asset. It conflates two completely different demand drivers.
The cleaner test would use retail derivatives volume, retail margin debt, options activity, and CFD trading rates, none of which are published on a comparable cross-country basis. In the US, Cboe data show that in Q3 2025, 2.15 million SPX 0DTE option contracts traded daily (57% of total SPX volume) with retail responsible for nearly half of all options flow. SPX 0DTE trading has grown more than five-fold over the past three years, with retail making up 50–60% of the volume. These are American figures. The equivalent numbers in Germany or Japan are vastly lower; the equivalent numbers in the UK, post-Brexit, are obscured by the migration of much retail derivatives flow to European venues. The instrument exists but the comparable cross-country dataset does not.
I flag this not to bury the cross-country result but to be honest about what it shows. The within-country test is decisive. The cross-country test is suggestive but contaminated by measurement issues that the academic literature has not yet solved.
V. The inner jets
Return to the social renter question. The model predicts that the propertyless will migrate up the risk curve when they have the means to do so. What about when they do not? The accretion disc analogy gives us the answer before we look at the data, because real accretion discs do not emit a single jet. They emit at multiple radii. The innermost regions, where gas is most compressed and most superheated, radiate at the highest frequencies. The outer regions radiate more diffusely. The disc is structured.
The same is true of the speculative periphery. Crypto and CFDs are the outer jets, accessible to people with £100, £500, £1,000 of deployable capital. There is a tier below this that operates at a lower minimum capital threshold, populated by venues that do not appear in the FCA’s high-risk investment basket because they are classified, regulatorily, as gambling rather than investing.
National Lottery scratch cards. Online slots. Fixed-odds betting terminals. Sports betting. The speculative migration thesis predicts that this tier should be populated, disproportionately, by precisely the cohort that the FCA chart appears to under-represent: people whose investable wealth is too small to clear the entry threshold for a crypto exchange but who still face the gap to the homeowner reference cohort.
The data on this is unambiguous, and it is grimmer than the crypto story.
Analysis of British Gambling Prevalence Survey data found that adults in the lowest income quintile spend an average of 12 to 14% of their net income on gambling, compared to 2% or less in the highest quintile. The income share spent on gambling is six to seven times higher at the bottom of the distribution than at the top. Adults in the most deprived quintile are more than seven times more likely to be problem gamblers than adults in the least deprived quintile, and ten times more likely if they play fixed-odds betting terminals. Punters’ losses worth £11 billion a year to the gambling industry are disproportionately skewed towards more economically deprived areas. Of online gamblers in Britain, 18% (around 3.3 million people) are in gambling-related debt, owing on average £10,000 each.
These are not the figures of a leisure activity unevenly distributed across the income spectrum. They are the figures of a transfer mechanism. The bottom income quintile is, on average, putting 12 to 14% of its net income through a venue with structurally negative expected returns. The same cohort, on the FCA’s high-risk investment chart, appears risk-averse. They are not risk-averse. They are speculating at the only tier their capital constraint allows.
The reference-dependent utility framework predicts this exactly. The social renter, the bottom-quintile household, the family on benefits: they are in the deepest part of the loss domain relative to the homeowner reference point. They face the largest gap. Prospect theory says they should be the most risk-seeking, not the least. But they cannot deploy capital they do not have into venues with thousand-pound minimums. What they can do is buy a £1 scratch card with the dwindling small change of a weekly food budget, or play a £2 spin on a high-street FOBT, or place a £5 accumulator on a Premier League weekend.
The portfolio they hold is functionally a single lottery ticket purchased fractionally each week. It has every property the prospect-theoretic agent demands: negative expected value, fat right tail, low entry threshold, immediate feedback, dopamine reward, and a non-zero probability, however small, of closing the gap.
The accretion disc analogy now resolves at full structural depth. The wealthy propertyless gamble on options. The middle propertyless gamble on crypto. The poor propertyless gamble on scratch cards. Same mechanism, three different rails, calibrated to three different capital constraints.
The state collects revenue at each tier: capital gains tax from speculative trading, gambling duty from the lottery and betting industries, VAT from the entire downstream infrastructure of betting shops and online platforms. The fiscal machinery is downstream of the housing distortion in a literal sense: the National Lottery alone returns around £1.7 billion per year to the Treasury, gambling duty raises another £3 billion, and the entire complex would lose its market if the upstream pressure that drives bottom-quintile households to spend 12 to 14% of their income on lottery products were removed.
This is the bit that makes the welfare arithmetic devastating. The retail investor losing £5,000 on shitcoins is the same phenomenon as the single parent spending £25 a week on scratch cards. They are points on the same speculative spectrum, driven by the same upstream distortion, deployed onto different rails by the same capital-constrained optimisation problem. To treat them as separate pathologies, one a problem of financial literacy, the other a problem of addiction and welfare, is to mistake symptom for cause at both ends simultaneously.
The social renter bar on the chart was the clue. The reason it sits low is that the chart is looking at the wrong rail.
VI. What the welfare arithmetic actually says
The standard regulatory response to retail speculation is to restrict the venues. Cap leverage on CFDs. Ban crypto promotions. Add cooling-off periods to options accounts. Restrict 0DTE access to qualified investors. The FCA banned crypto exchange-traded notes for retail customers in January 2021 and reversed the position in October 2025. The cycle repeats: regulators identify a venue, restrict access, retail demand migrates, a new venue emerges, regulators identify it, restrict access. Spread bets to CFDs to crypto to meme stocks to 0DTE options to prediction markets. The rails change. The demand does not.
The model explains why. The demand is generated upstream, at the level of the housing distortion. Retail flow into lottery assets is not a market failure to be regulated away. It is the rational response of agents who have been priced out of the only asset that matters and who are seeking, with the limited tools available to them, distributions that have any probability of closing the gap. Close one rail and another opens. The water finds its level.
The losses concentrate on the periphery. Retail options traders typically realise losses of 5 to 9% around earnings announcements, rising to 10 to 14% for high-volatility securities, with average trade size around $2,006 and median size $337. Many small bets, accumulating to large aggregate losses. The astrophysics holds here too. Accretion disc jets are how energy escapes the system. In the financial analogy, the speculative periphery is how the propertyless cohort’s capital escapes the system, into the pockets of market makers, exchange operators, and the surprisingly small number of retail traders who happen to land in the right tail. The young renter putting £5,000 into shitcoins is not competing with the landlord who put £50,000 down on a buy-to-let. They are funding the system’s exit valve.
The policy implication runs in the opposite direction from current orthodoxy. If you want to reduce retail speculation, you do not need to regulate the venues. You need to remove the upstream distortion. Compress the risk-adjusted return on the dominant asset through land value taxation, planning reform, removal of mortgage interest deductibility, or capital gains taxation of primary residences, and the entire downstream cascade compresses with it. The propertyless agent who can buy a flat does not need to hold a lottery ticket on a memecoin. The Markowitz frontier they face becomes the same frontier the homeowner faces. The accretion disc dissipates.
This is not a marginal claim. It reframes the entire retail-investor-protection apparatus as a downstream cleanup operation for a problem the political system refuses to address at the source. The FCA cannot fix the British credit channel. The CFTC cannot fix American zoning. ESMA cannot fix the Dutch mortgage interest deduction. The regulators are pointed in the wrong direction by design, because the upstream variable is politically untouchable.
VII. The view from the disc
What is striking about the empirical work is how visible the mechanism becomes once you look for it. The FCA tenure breakdown is not buried in obscure data. It is in a published report. The Gambling Commission’s income-quintile figures sit alongside it. Nobody has plotted either of them in this context because nobody was looking. The Cboe 0DTE statistics are public, the IFS homeownership cohort data is public, the OECD price-to-income series is public. The argument requires no proprietary data, no Bloomberg terminal, no academic affiliation. The reason it has not been made is that the literatures are siloed: behavioural finance does not talk to housing economics, which does not talk to retail trading microstructure, which does not talk to gambling research. The accretion disc analogy is what connects them.
The black hole is invisible. What we see is what it does to everything around it. The British retail investor in 2026 looks pathological by every conventional metric: high leverage, short holding periods, attraction to negative-expected-value assets, accumulation of losses they cannot afford. The British problem gambler looks pathological by a different set of metrics: chasing losses, hiding behaviour, neglecting bills.
The conventional explanations are financial illiteracy, social media, breakdown of long-term thinking, addiction, individual moral failing. The structural explanation is that both populations are rationally optimising over a utility function that conventional models do not see, in response to a distortion conventional models do not measure, on a frontier conventional models do not draw. The 0DTE trader, the crypto holder, and the scratch-card buyer are the same agent at three different capital tiers.The retail investor is not malfunctioning. The problem gambler is not malfunctioning. The market is.
A working paper version of this argument, with the full prospect-theory derivation and the FCA tenure regression specifications, is in preparation. Comments welcome.