
Hōnea Kore
New Zealand. From Henry George's most notable success story, to the most severe victim of the Rentier Black Hole.


In 2022, analysts at the Reserve Bank of New Zealand set out to answer a reasonable question, why do New Zealanders hold so much of their wealth in houses? They built a standard Markowitz portfolio model, fed it twenty years of returns data, and asked it what a rational New Zealander should hold.
The answer was houses, that’s about it. Once tax treatment was included, the optimal portfolio was one hundred percent housing. The model was then asked what the allocation should be if house prices grew at a rate the Bank itself considers sustainable. The answer was zero.
One hundred percent at observed returns. Zero at sustainable returns. Both numbers appear in the same document, Analytical Note AN2022/07, Housing as an Investment Asset in New Zealand. The note concludes with some gentle advice about diversification and the observation that New Zealanders hold one egg in their wealth basket. They then printed the report, stuck it on the shelf, and it would seem as if no one else has ever dared to pick it up again.
Using figures from the government and the national bank itself, even commentary from both, I am able to show you fully and extensively, that New Zealand has one of the most severe Rentier Black Holes I have encountered.
The three conditions
A rentier black hole requires three structural conditions. New Zealand satisfies all three more completely than any developed economy I have examined.
E, Elasticity
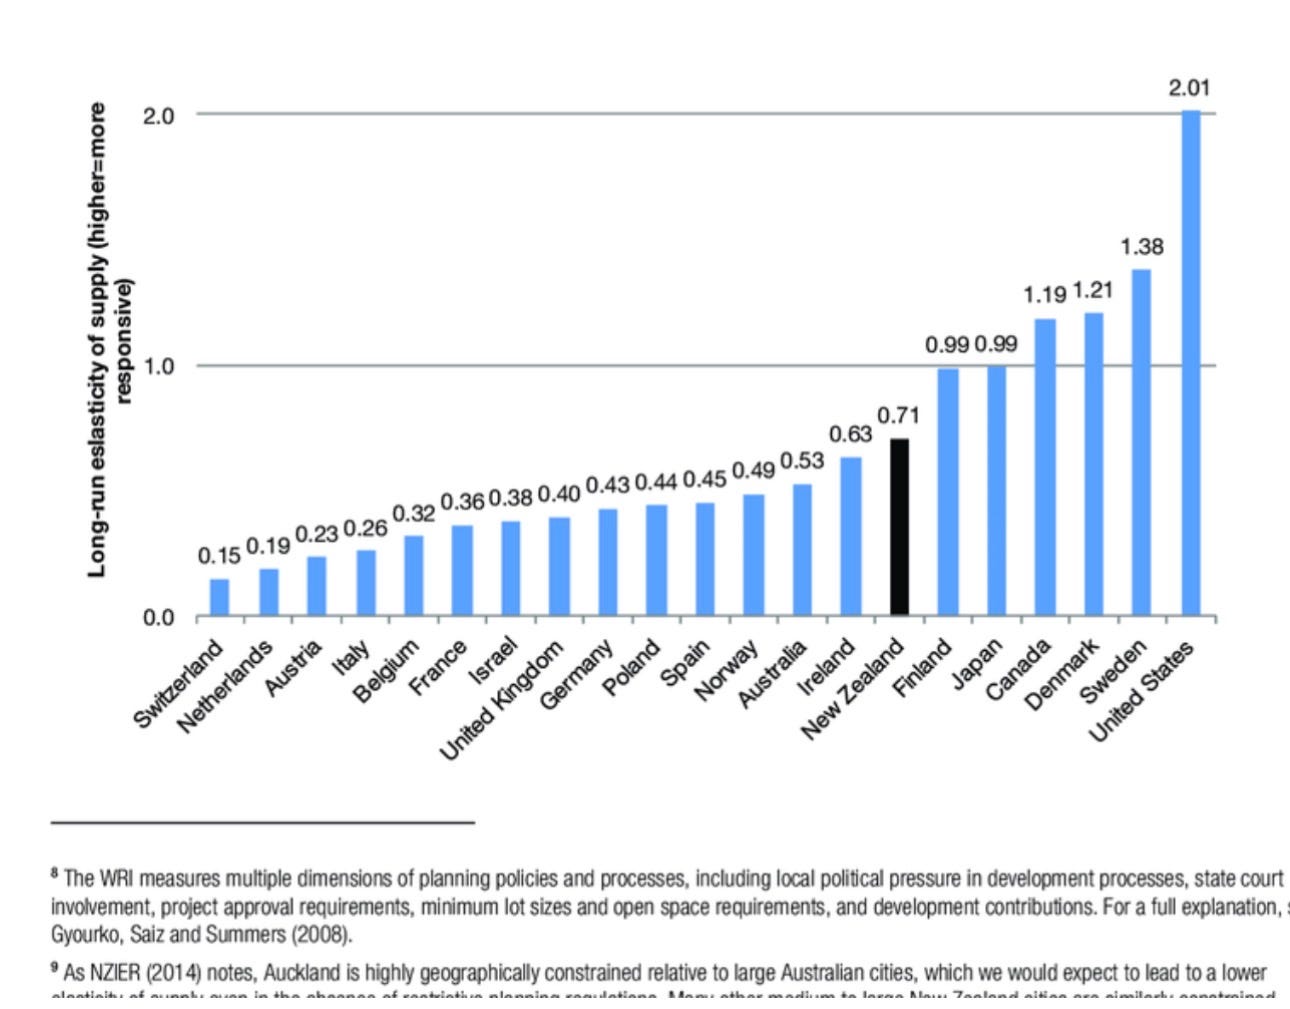
Roughly thirty percent of New Zealand’s land area is protected conservation estate. Most of the rest is mountain, and the population concentrates in a handful of cities pressed between ranges and coasts. Estimated housing supply elasticity sits around 0.7, among the lowest in the developed world already, but when considering the dense focus of 83% of the population into its urban cores, this elasticity trends to a short run 0, when prices rise, supply barely answers. There is one genuine exception, and it matters. Auckland’s upzoning from 2016 measurably lifted consents and slowed rent growth relative to the counterfactual. It is the one condition New Zealand has partially loosened, in one city, and the difference it made is visible.
C, Collateralization and Credit
Two thirds of New Zealand bank lending is to households, overwhelmingly secured on housing. The mortgage stock is floating or fixed for one to three years, so central bank rate changes reach household cash flow within months rather than decades. This is the fastest monetary transmission in the Anglosphere, and it runs in both directions. The retirement savings scheme, KiwiSaver, can be withdrawn for a first home deposit, so even the pension system feeds the collateral channel.
T, Taxation
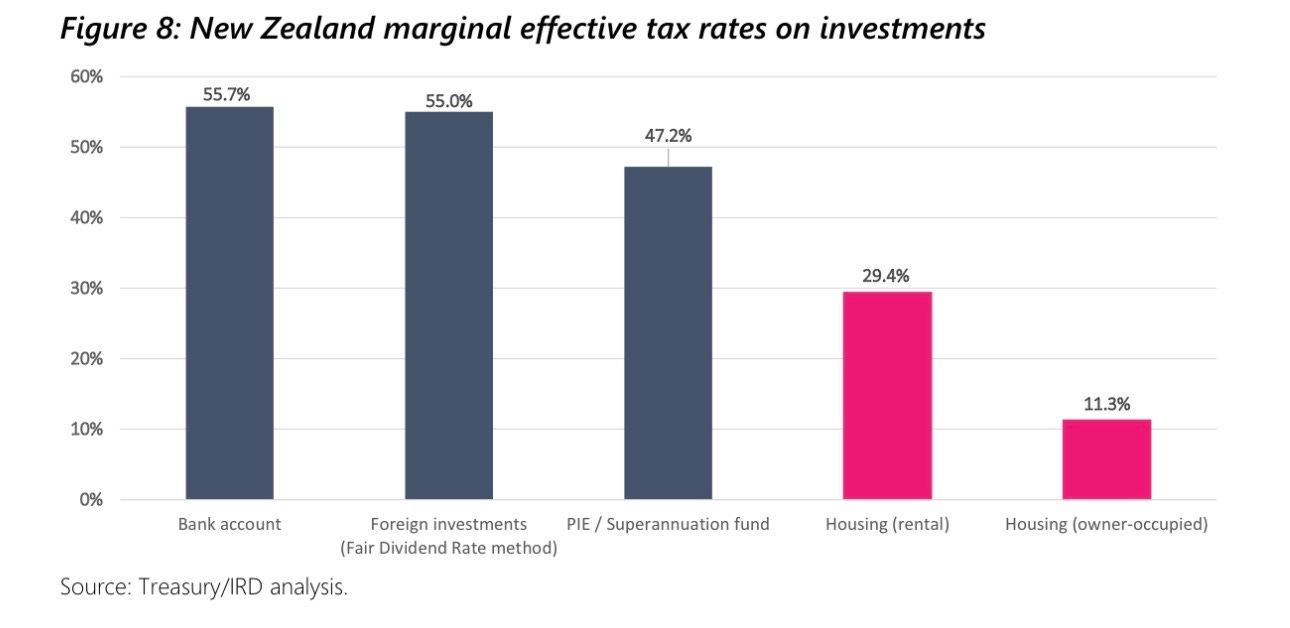
New Zealand has no capital gains tax. Stamp duty was abolished in 1999, estate duty in 1992, gift duty in 2011. The land tax, of which more shortly, went in 1990. Treasury and Inland Revenue’s own calculations, produced for the 2018 Tax Working Group, put the marginal effective tax rate on a bank deposit at 55.7 percent, on foreign shares at 55.0 percent, on a pension fund at 47.2 percent, and on an owner-occupied house at 11.3 percent. The system does not merely spare the rentier asset. Through the foreign investment fund regime, which taxes overseas shares on a deemed return whether or not any gain is realised, it actively taxes the alternatives. A New Zealander choosing between a diversified portfolio and a second house faces a tax wedge of roughly forty percentage points, in the house’s favour.
Where the capital went
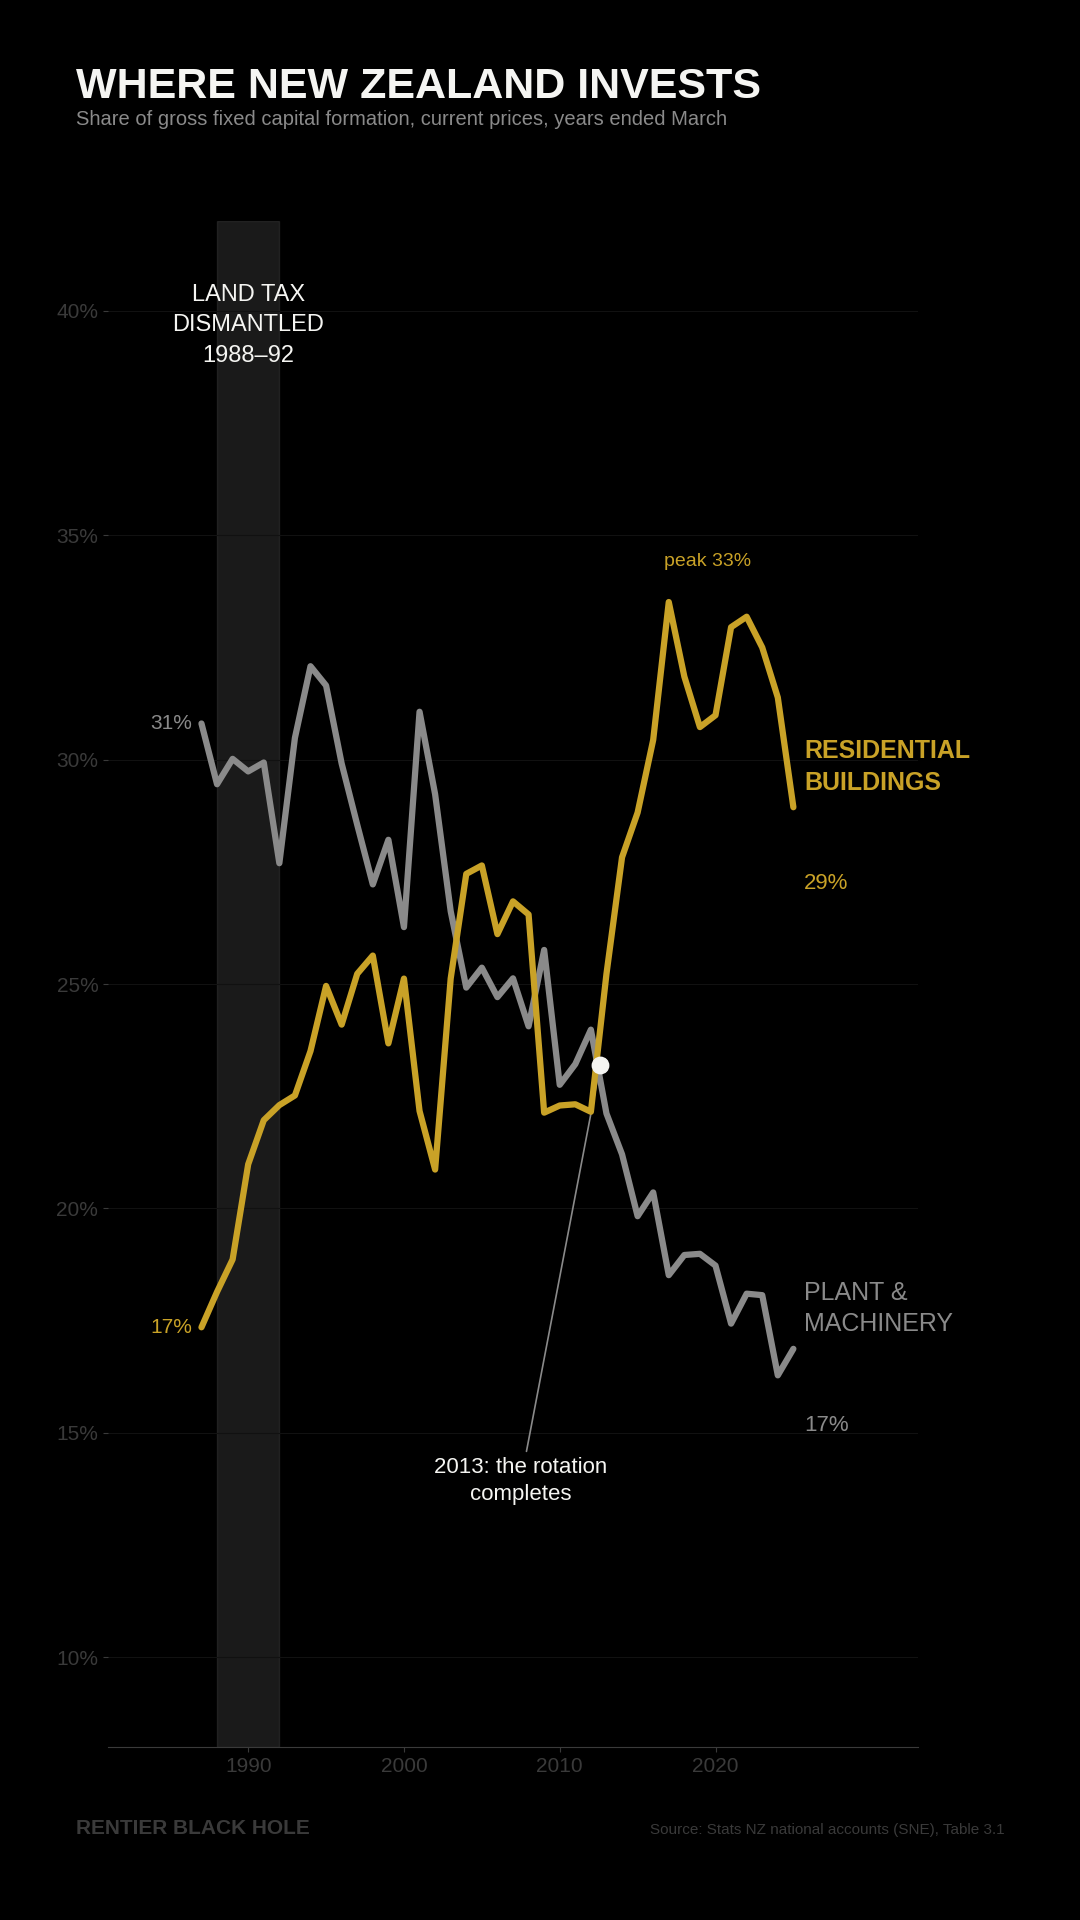
In 1987, plant and machinery took 31 percent of New Zealand’s gross fixed capital formation, and residential buildings took 17. Over the following four decades the two lines swapped places almost exactly: housing peaked at 33 percent of all capital formation in 2022, while machinery fell to 17. Housing investment grew at 7.4 percent a year on average; machinery at 4.1. The crossover first occurs in 2004, reverses briefly after the global financial crisis, and completes for good in 2013.
This is merely the present value of the new housing structures built, not the land under them, or the increasing funds and credit chasing merely the existing structures at higher prices, and that is a bigger element requiring its own section.
The crash that changed nothing
New Zealand is currently living through the largest house price correction in its recorded history. Prices sit roughly 15 percent below the November 2021 peak in nominal terms and 28 percent below in real terms, and have been flat for three years.
Despite this monumental collapse, by Reserve Bank’s own sustainability assessment still places prices above sustainable levels at 6x the average income nationally and 7x in Auckland.
With the RBNZ hiking rates out of the COVID pandemic, from 0.25% to 5.5% in June 2023, The same short-fixing mortgage structure that transmitted the boom transmitted the tightening within months, while the state turned every dial simultaneously, consumer credit rules, loan-to-value restrictions, investor tax changes. The correction was not an accident that happened to the structure. It was the structure, running in reverse.
A crash of this size should have produced a Minsky moment. Defaults, bank losses, credit contraction, fire sales, yet for now the banking system survives for a frankly perverse reason.
The Averted Crash
Eighty-four percent of New Zealand’s bank lending is held by four Australian-owned banks. Their New Zealand subsidiaries are locally incorporated and capitalised to requirements among the highest in the world, following the Reserve Bank’s 2019 capital review. Every borrower in the boom was stress-tested at servicing rates far above the rates they actually paid. Additionally New Zealand mortgages are full recourse, you cannot post the keys and walk away.
So when the correction came, almost nobody defaulted. Arrears barely moved through an 18 percent nominal fall. The loss absorption happened somewhere else. Households whose repayments doubled did not hand back the house, they stopped spending. All to ‘cling’ to the mortgage, creating the aptly phrased ‘mortgage prisoner'. The choices in negative equity with a large jump in the mortgage rate in a recourse market are fairly simple. You can default, lose your entire deposit, your largest asset, and then be burdened with the remaining negative equity as a personal liability that will most likely bankrupt you. Alternately, you cut back any discretionary spending, tighten the belt, keep paying the mortgage, and pray the property market comes back. Praying and suppressing consumption is what a large section of the economy chose, leading to a recession in Q2 2024- Q3 2024. The perverse effect of this even during such a colossal down turn, is a variance suppression in the property market from this ‘clinging’ behaviour, which seems odd to say given the size of the current crash. Yet in the case New Zealand was a non-recourse market, we would have seen a shorter much sharper washout in the property market, which on the surface sounds horrendous, but short sharp washes clear the board, what New Zealand has now is a lethargy of clinging behaviour, with thousands of would be defaulters dedicating themselves to the mortgage and praying on a recovery, and very little else.
However, when markets cannot efficiently clear on price and quantity, they find another path, and in this case, the number that cleared was in its citizens, in the year to September 2025 New Zealand recorded a net loss of around 46,400 of its own citizens, mostly to Australia.
The credit system was insulated by design buffered on Australian balance sheets, and the adjustment was rerouted through household cash flow into aggregate demand, output, and ultimately emigration. The banking system emerged intact. The productive economy and the young absorbed the correction instead.
The country that invented the cure
The most infuriating element of this case, is that New Zealand has already tried the cure, it became one of the worlds wealthiest nations, then subsequently, ripped it to shreds through spurious exemptions, and now they are sitting in the results.
In 1878, New Zealand introduced the world’s first national land tax. The 1891 version was explicitly graduated to break up the great pastoral estates, and it worked. The estates were subdivided, closer settlement followed, and the small-farm export economy that resulted, made New Zealand by the middle of the twentieth century, roughly the third richest country on earth per person. By 1895 the land tax supplied about three quarters of combined land and income tax revenue. When you have the tax, land disaggregates, capital flows into production, the country gets rich.
Then, over the following century, the tax was dismantled. Not repealed, at first, merely Exempted, bastardised, truncated. Sports clubs, Charitable estates, Agricultural land, In 1976, the family home. By 1982 an official review found that only five percent of the country’s land value remained in the base, and that the tax had no perceptible redistributive effect, a finding that is less an indictment of land taxation than a description of what remained after the exemptions had eaten it. When abolition came in 1990, the government’s stated justification was that the exemptions had made the tax unfair. The loopholes became the argument for removing what was left.
The local story is equally damning. For over a century, New Zealand ratepayers could petition for a poll on whether their council should rate land value or capital value, that is, whether to tax the land or to tax the buildings on it. In hundreds of polls, they chose land. By 1982, ninety percent of municipalities rated on land value, covering roughly eighty percent of local government revenue. Wherever the question was put to the people, the people chose to tax land, the reversals came administratively. In 1988 the right to demand a poll was withdrawn. The 1989 local government amalgamations then dissolved land-rating councils into larger capital-rating ones, and through the 1990s most major cities completed the switch. By the end of the decade New Zealand had moved from taxing what people hold to taxing what people build, at both national and local level, inside a single political generation.
Keep track of the timing, the poll right died in 1988. The national tax died in 1990. Then in 1989, in a change an establishment economist would later call likely the most distortionary tax policy towards housing in the OECD, New Zealand moved to taxing retirement savings on an income basis while leaving housing untouched, sharpening the tax penalty on the main alternative asset at the precise moment the tax on land was removed. Both blades of the wedge, set in the same three years. The capital rotation chart begins its structural break shortly after.
What the Reserve Bank found
Which returns us to AN2022/07, because the note deserves a closer reading than it has received, including by its authors.
The note measures, with entirely conventional methods, the following. Housing delivered the best risk-adjusted return of any asset class available to New Zealanders over 2000 to 2020, a ratio of 1.5, against 0.5 for global equities and 0.4 for the local stock exchange. Leverage, uniquely available against housing, improves it further. The tax system improves it again, to the point of the corner solution, the optimal portfolio becomes entirely housing. Housing returns were negatively correlated with KiwiSaver funds, making the house not merely the best asset but the portfolio’s hedge. And the note observes, in passing, that the accumulated wealth reflects mainly rising land values rather than investment in new dwellings, driven by the constrained supply of land.
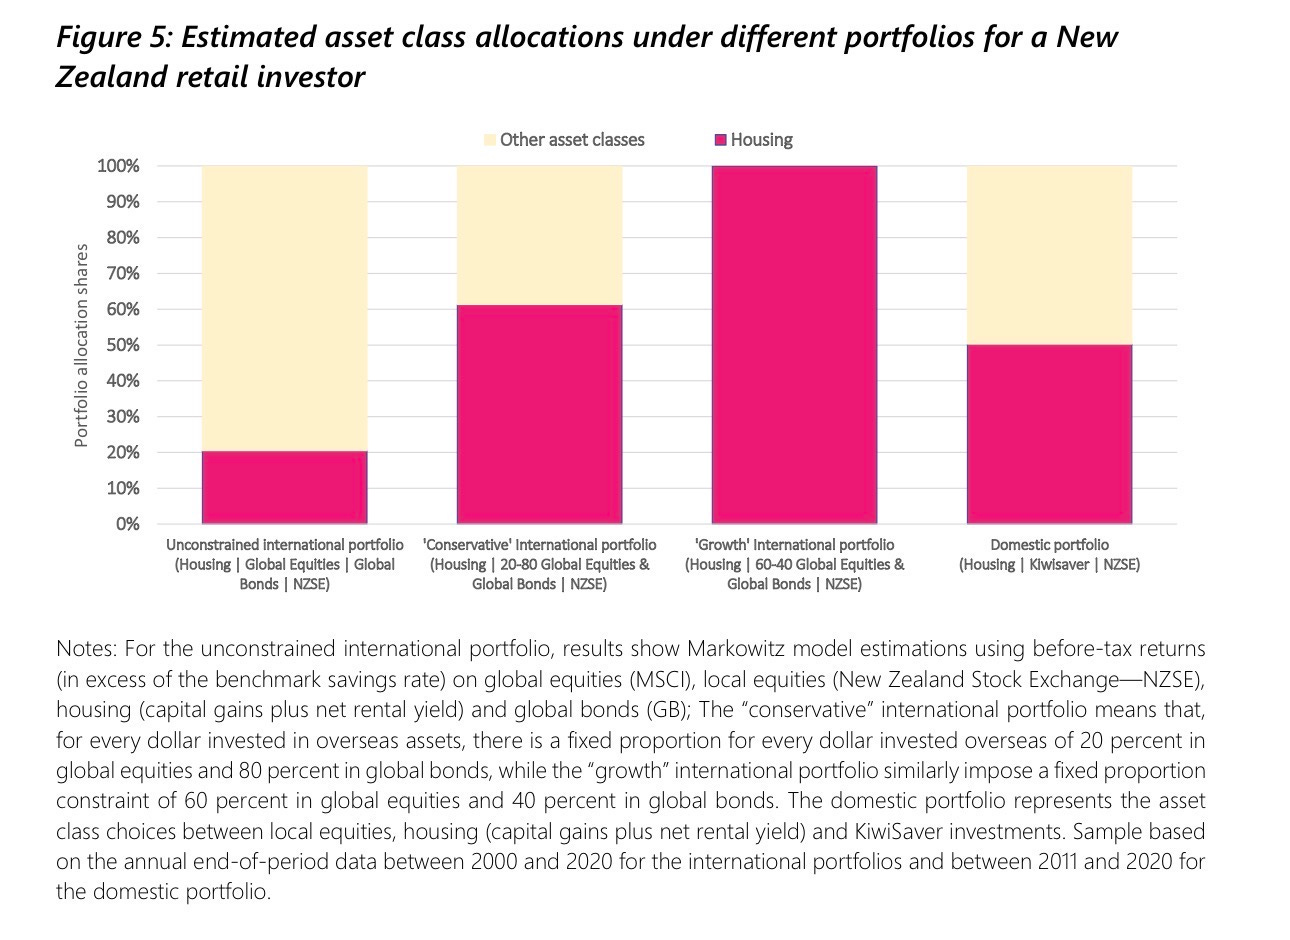
Read that list against the three conditions. The tax wedge is charted. The credit channel is measured. The supply constraint is named. Every input of the black hole appears in the document. What never appears is the loop. The note states its own boundary with admirable precision, the modelling exercise takes past asset price changes as given.
But the prices were not given. In an asset with near-zero supply elasticity, the buying is the price, the price is the return, and the return recruits the next buyer. The 10.9 percent average return the model treats as an input was the output of two million households running the model’s own logic for twenty years. The remarkably low volatility that makes the risk-adjusted return so attractive is not a property of bricks; it is the signature of a one-way flow into a fixed stock combined with the variance suppression of a recourse market. The Bank measured the gravity, precisely, and did not notice that the gravity was self-generated. Its own sensitivity analysis contains the tell, at sustainable price growth, the optimal allocation collapses to zero. There is no version of this asset that is both sustainably priced and worth holding. The entire portfolio case is the unsustainability.
There is one more detail. The note exists because the Minister of Finance directed the Reserve Bank in early 2021 to have regard to house price sustainability, a unique instruction internationally, resisted by the Bank at the time. That clause was moved out of the Bank’s monetary policy objectives in 2023, and from December 2023 the committee was refocused on price stability alone. The system briefly instructed itself to look, looked, published the anatomy, and then deleted the instruction.
Who’s Holding the Bag?
Since 1978, New Zealand’s measured labour productivity has roughly doubled. Real wages have risen by roughly half that. The two series track each other closely for a decade and then break apart, and the break occurs between 1988 and 1992, the same window in which the land tax died, the rating polls died, and the savings tax flipped.
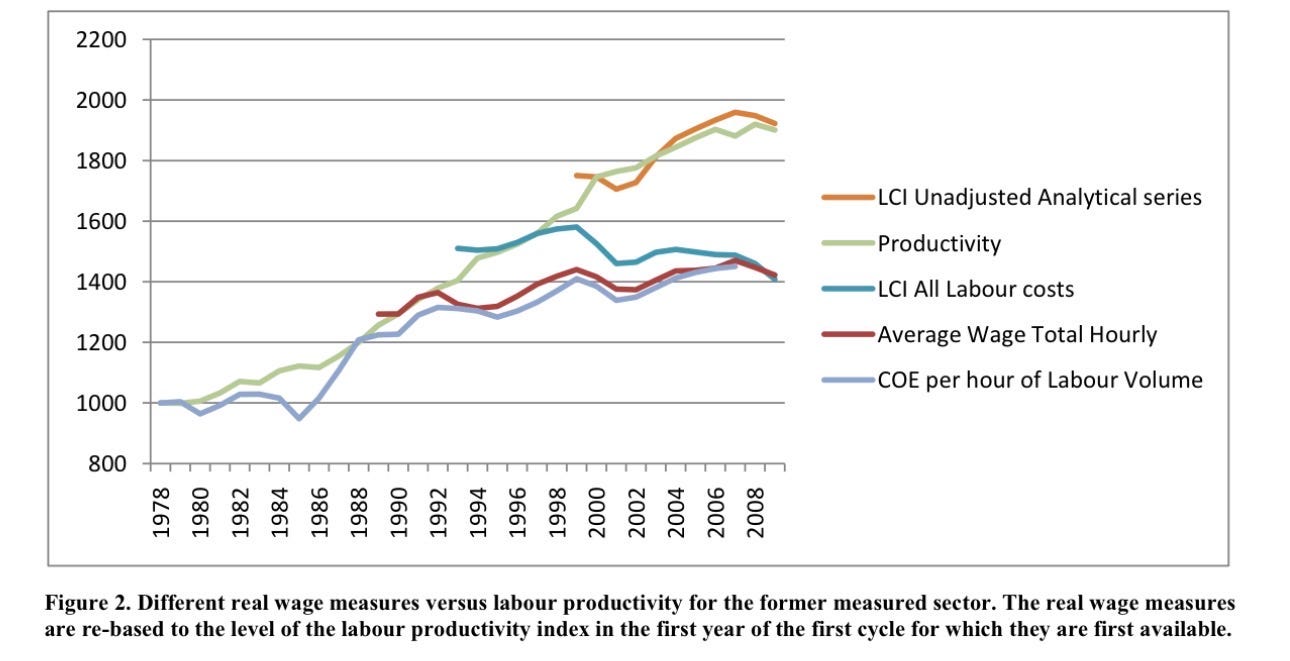
The honest decomposition of that gap has two phases, and I will claim only one of them. Through the 1990s the gap is substantially a bargaining story, the Employment Contracts Act, eleven percent unemployment, the collapse of union coverage. The labour share of income fell sharply, and a wage-bargaining account explains much of it. But the labour share has been roughly flat since 2012, and the gap has kept growing. A bargaining story cannot widen a wage-productivity gap while the labour share stands still. What can is a price wedge, when the cost of living, dominated by rent and land, inflates faster than the price of what workers produce, real consumption wages detach from real product wages with no change in shares at all. That component, the wedge that runs through land prices rather than through bargaining power, is the black hole’s fingerprint.
I call it the housing wedge, visible in numerous economies globally, notably in the UK with the ‘productivity puzzle’. With a simple dissection however, it is easily revealed. Imputed rent, is included in the GDP figures of every nation as an accounting methodology that allows nations with different rates of home ownership to be compared fairly. It also breaks the basic calculation of simply productivity, once the home ownership and the rent starts screaming upwards. This represents approximately 15% of New Zealands GDP currently.
Productivity simplified is GDP split across hours worked in the economy, the hours are the same, yet the property and the rents have soared. So the headline productivity figure naturally detaches, from real wages.
Money for nothing
The accumulation accounts, which Statistics New Zealand publishes and nearly nobody reads, record the last layer, the one the investment chart cannot see. They decompose changes in each sector’s net worth into transactions, things bought, built, and saved, and revaluations, things that simply became worth more.
For households, from 2008 to 2024, net saving out of income totalled 14 billion dollars. Residential capital formation, the actual building of houses, totalled 212 billion. But, the revaluation of household-owned land totalled 425 billion dollars, with a further 207 billion of revaluation on the buildings themselves.
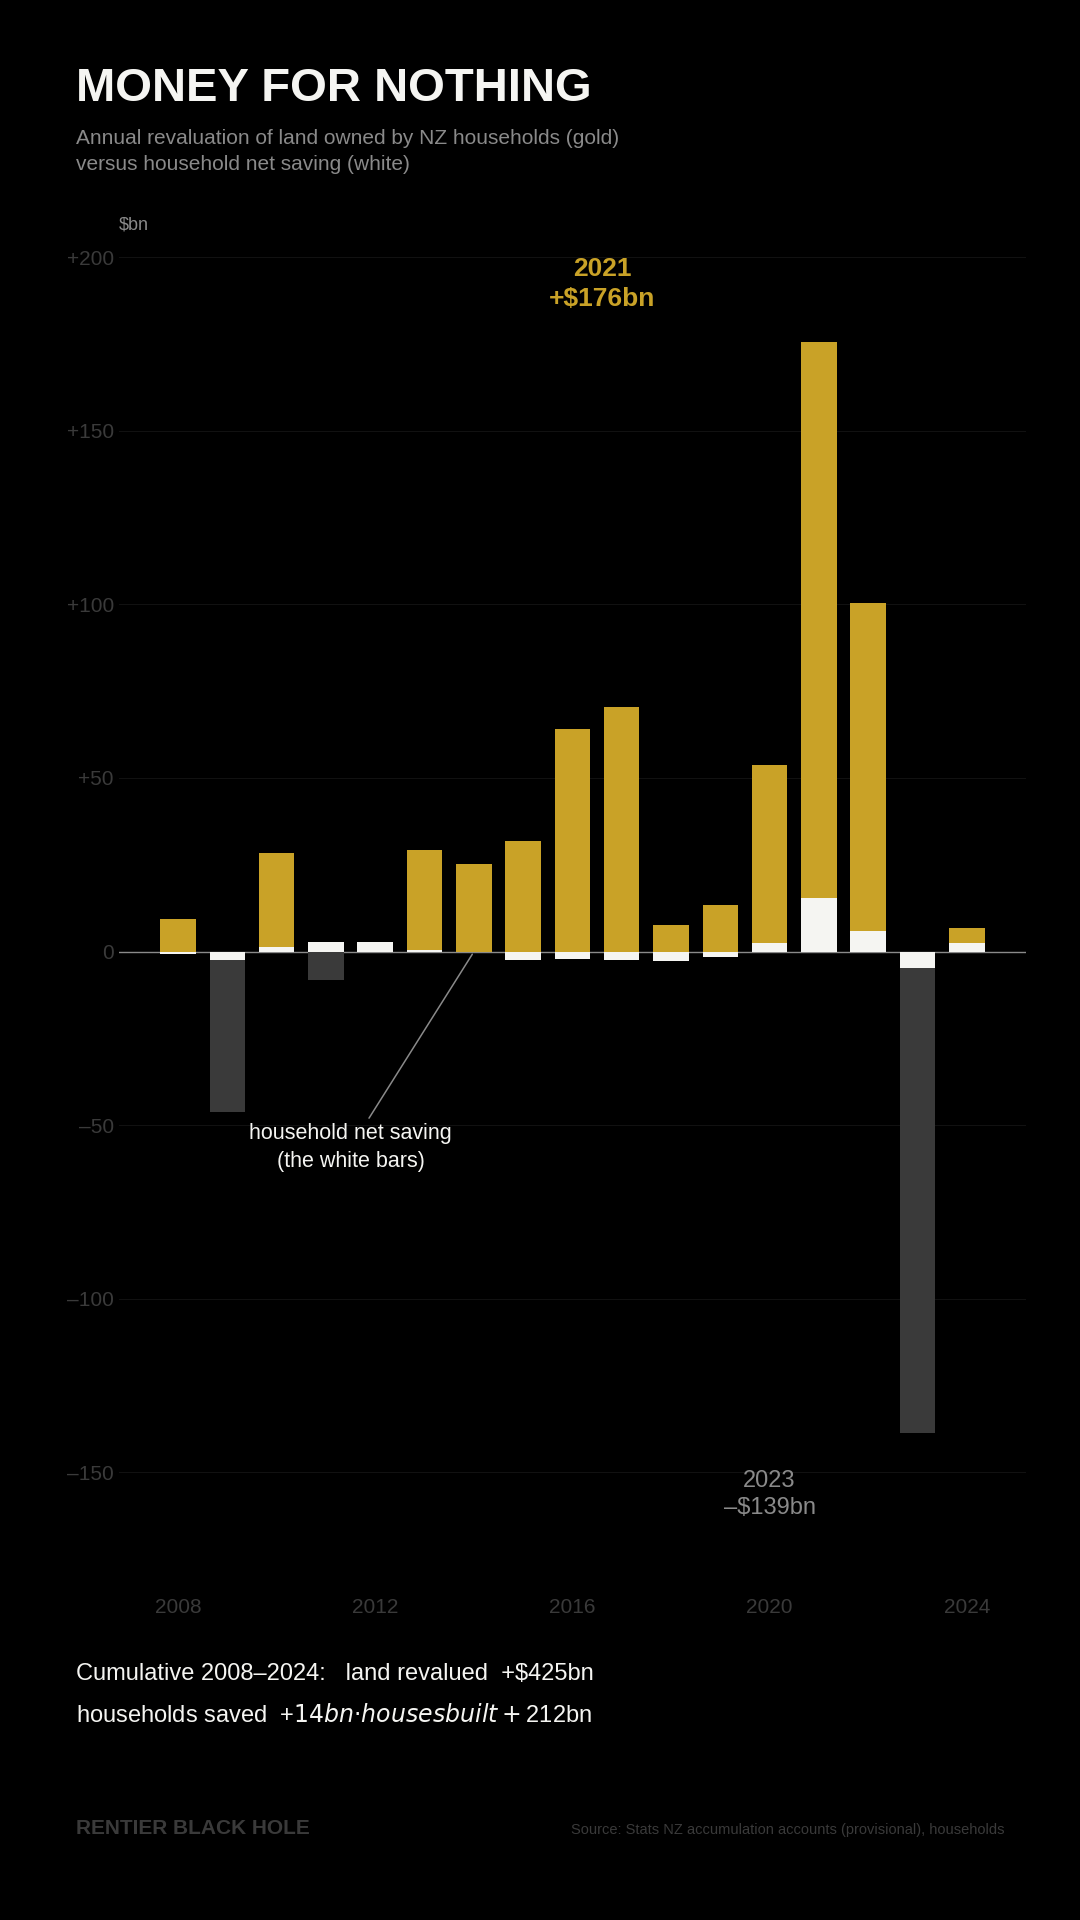
Over seventeen years, the land under New Zealand revalued by thirty times what its households managed to save, and by twice what the entire nation spent building homes. In the single year to March 2021, land revalued by 176 billion dollars, roughly half a year’s GDP, materialising in section prices in twelve months. Two years later, 139 billion of it evaporated. A national balance sheet growing overwhelmingly through a channel that produces nothing, and contracting through the same channel, is not an economy accumulating wealth, It is an economy revaluing its own collateral and booking the revaluation as wealth.
Hōnea Kore
New Zealand matters because it is the control group that ran every treatment. Foreign buyers, banned since 2018, except Australians and Singaporeans. Speculation, taxed through the bright-line test which was rammed up to 10 years. Landlord deductions, removed. A major city, genuinely upzoned, with genuine marginal results in densification. Monetary policy, tightened into the largest correction in the country’s history, deliberately, with the Governor accepting in select committee that the Bank was engineering a recession. Everything the housing debate proposes, somewhere on its spectrum, has been tried on these islands, and most of it has already been partially reversed, the bright-line test cut back, interest deductions restored, both while prices were still falling.
And after all of it, prices remain above the central bank’s own sustainable range, machinery’s share of investment remains half its 1987 level, the wage-productivity gap remains, and the young remain in the departure queue. Because none of the treatments touched the three conditions. The land is still fixed. The credit still flows against it. The tax system still pays you to hold it, and taxes you for holding anything else.
The country that invented the land value tax, that voted for it in hundreds of local polls for a century, that rode the productive boom it enabled to third place in the world, dismantled it by exemption, procedure, and reorganisation, slid to twenty-sixth, and then watched its central bank rediscover the mechanism, publish two thirds of it, and file the findings under portfolio advice.
What has happened is a simple sleep walk, of seemingly rational small pruning, nipping and tucking of a policy that made this nation so fantastically wealthy, that fundamentally killed the mechanism for its own development.
The results of remaining within this Hōnea Kore are simple to diagnose, its affects are terminal without intervention, and make up the remainder of my body of work, but in brief:
Real wages will remain stagnant, the productivity real wages gap will widen, inequality will continue to soar, household formation will be further delayed, the birth rate will remain below replacement, fixed capital formation will be stuck in appreciating housing structures not production or innovation. Left with sufficient time to run, what you find if you are lucky is the clinging effect is merely a glass floor, pressed hard enough it shatters into a Minsky style collapse. What remains afterwards when the smoke rolls out, will be the manufacturing, real industry, that was left to rot while the economy decided instead to gamble on housing.
This recent crash is a preview, if it is left to run again without intervention, the results will not improve. It is not a miracle that has prevented a financial collapse to date, it is the crushed new entrants who name themselves mortgage prisoners, locked into payments or total destitution by recourse. This market, unable to clear effectively on price and quantity, has cleared instead on immiseration, the unborn, and a generation who have decided their best choice is to leave.
I would recommend the RBNZ, digs out what they left on the shelf, give it a thorough read once again, before the nation is beyond the event horizon.
Sources: RBNZ Analytical Note AN2022/07; Treasury/IRD marginal effective tax rate analysis (Tax Working Group, 2018); Stats NZ national accounts Table 3.1 and accumulation accounts 2008 to 2024 (provisional); RBNZ banking sector statistics and Monetary Policy Remit history; REINZ house price index; Stats NZ international migration; Rosenberg (2010); Reece (2003); Barrett and Veal (2012); Coleman (2017); Gemmell, Grimes and Skidmore (2019); Land Tax Abolition Act 1990. The two charts are drawn from the raw Stats NZ series; data and code available on request. The video version of this essay is on TikTok and YouTube.
This reminds me of “Mancur Olson cycle” which describes the process by which stable societies accumulate special-interest groups (“distributional coalitions”) that gradually slow economic growth, followed by disruptive shocks that clear those groups and enable a new phase of rapid growth written 44 years ago